What
A key funnel was up for a redesign. We took a data-driven approach to understand the as-is, conceptualise the ideas and measure the impact.
Responsibility
I was the in the lead and was supported by a UI designer. I focussed on the process, stakeholder management, UX research and impact analysis.
Result
After the A/B test we were confident to say we improved conversion with 4% and improved the CX score with 5% along with other positive results we measured.
Roles
deliverable
Methods
Impact measurement report
Redesigned funnel
Design lead
KPI framework
User research
Design thinking
Data-driven

Initial research workshop with the team
Exit survey results for the as-is understanding
Challenge & approach
A key funnel to book an appointment for an eye test was up for a redesign as the UX was outdated as well as the technology. I was in the lead with help from another designer who focussed mostly on the UI designs.
We first took the approach to understand the as-is situation through research, measure the current customer satisfaction and other perspectives as conversion, feedback, usability, accessibility, speed, etc.
Based on that we went through some iterations of idea generating and testing to define the to-be. Once it was live we measured the same perspectives in the new design to understand what impact we made and how we could improve further.
Research the as-is situation
To get a better understanding of the as-is we researched existing analytics data, did competitor research, understood the business objectives, looked at existing user research, did user research, dove into accessibility guidelines, looked at the website performance, did employee interviews, measured existing satisfaction and effort and analysed the journey and flows ourself.
Based on this data we refined the goals of the user and the business and got started on the redesign.

Interviews with store employees

Overview of what we want to measure and why

We looked from 6 different perspectives to measure the customer experience

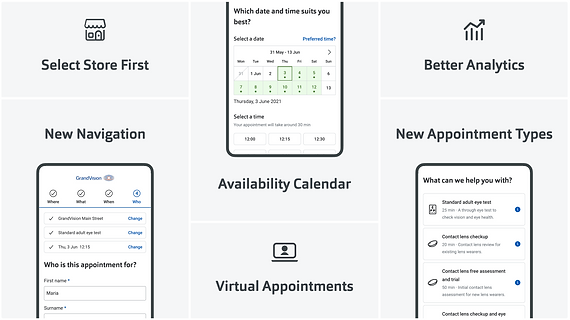
Defining the to-be flow
With the as-is understanding, we did initial brainstorms with the important stakeholders as the local brands, technology leads and the product owners to get their input. Based on that we went through several iterations where we created concepts, prototypes, did moderated and unmoderated user testing to in the end finalise the designs.
During the refinements we tweaked some final elements and supported the developers while building the designs. Alongside we were in contact with the data team to make sure all interactions where going to be tracked properly.
To-be designs for 1 specific brand
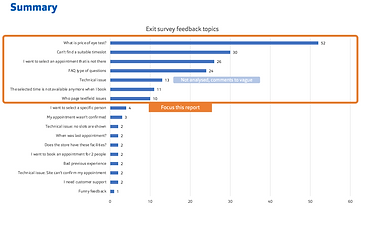
Measuring the impact
Now came the exciting part, going live. We worked together with the CRO testing team to A/B test the new funnel against the existing one to get reliable data to compare the two.
Our efforts paid off as can be seen in the snapshot of the report on the right, that we used to share our data-driven approach and outcomes.
After the initial numbers we did some additional deep dives on how individual pages and elements were performing and where we could improve. We continued this process to keep tweaking and improving the flow.

Snapshot of redesign impact report

Snapshot of further data deep-dives to keep improving